On this Page
Science objectives for future CMIP
CMIP provides an important resource for understanding climate change processes and variability and is an increasingly important source of global climate projections used across a range of industries and sectors. Driving forward science remains at the heart of CMIP and there are a large number of key questions which can be answered with future CMIP simulations, including those planned for the CMIP AR7 Fast Track.
New scenarios, overshoots, emissions-driven runs, and better carbon cycle representation
Knowledge of how our climate system will evolve under climate change is always improving. With this, the climate scenarios derived by ScenarioMIP require updating at least every seven to eight years. Scenario research is a key part of climate science and allows scientists to explore
- Different socio-economic futures for our world,
- Different impacts of climate change, as well as possible mitigation and adaptation strategies, and
- The effects of different drivers of climate change.
Combining new future scenarios with updated model capabilities also allows scientists to consider different net zero pathways with new tools. Increased model sophistication and stability now allows for more models to run the updated scenarios in emissions-driven mode.
Emissions-driven vs concentration driven models
Historically, Earth System Models have run using scenarios based on atmospheric concentration of pollutants (e.g. carbon dioxide, methane, aerosols). These are known as “concentration-driven” models. To define the concentrations of pollutants in the atmosphere, many assumptions need to be made about the processes controlling their sources and sinks. To do this in CMIP6 and earlier phases, pre-defined pathways were used to determine the atmospheric concentrations of pollutants in the model. This doesn’t allow for important coupling mechanisms which can feedback on pollutant concentrations.
More recent model developments now allow some models to run in what is called “emissions-driven” mode. For this, the model is forced with pollutant emissions which can then interact with other processes in the model. A key example of this is carbon dioxide. Climate policies are typically defined in terms of emissions for carbon budgets and timing of net-zero. Additionally, emissions-driven climate metrics, such as the transient climate response to cumulative emissions of carbon dioxide (TCRE) and Zero-Emissions Commitment (ZEC), are extremely policy-relevant.
Allowing for carbon emissions-driven simulations in future CMIP phases has scientific benefits, especially in understand and quantifying the carbon cycle and temperature ‘overshoot’ pathways.
Emissions-driven simulations will allow for improved process understanding of our carbon cycle and carbon removal mechanisms. Carbon-cycle feedbacks such as those between carbon, the ocean, vegetation, soil, and land-use, can be better calculated in a model in emissions-driven mode. As carbon-cycle feedbacks are one of the dominant sources of uncertainty between different CMIP models, more emissions-driven models in future CMIP simulations should help address this issue.
It is becoming increasingly clear that to reach current net zero pledges, an amount of temperature overshoot will be required. This is where, after the 1.5°C temperature limit is temporarily exceeded, before being gradually decreased through sustained net-negative carbon dioxide emissions. Removing carbon dioxide from the atmosphere (known as ‘Carbon Dioxide Removal’ or CDR techniques). Emissions-driven simulations will make understanding the processes behind CDR in Earth System Models easier to analyse, helping scientists better understand how our climate might evolve in the future under different emission scenarios.
For more information on carbon emissions-driven runs, you can read the paper led by Strategic Ensemble Design Task Team co-lead Ben Sanderson:
The need for carbon emissions-driven projections in CMIP7
Increasing model complexity
In CMIP science, the term ‘Earth System Model’ is typically used to describe models with an atmospheric and an oceanic component, which are coupled together. Additional components can be added to models to increase the complexity and sophistication, such as biological and chemical processes. The addition of these complexities allow models to make more accurate projections of the climate and help scientists answer a range of questions on the past, present, and future climate.
Through CMIP phases, modelling centres have increased their model’s complexity, adding components such as those which simulate the land surface, sea ice, and biogeochemistry. However, there is still work to be done. Existing model components can be improved, and additional components can be added.
In the next phase of CMIP, many more models are aiming to include dynamic ice-sheet calculation (including land ice), dynamic vegetation with simulated plant production demography, wildfires with interaction emission or land-surface interactions, coupled biosphere and chemistry, the nitrogen cycle, and ocean ecosystems (e.g. plankton and diatoms). The introduction or improvement of these model components will widen the range of scientific questions that can be addressed by CMIP data.
Tipping points
Climate tipping points are an increasingly active area of research. Certain climate systems have been identified as at risk of irreversible changes when certain critical thresholds of warming are reached. These are known as tipping points. One example of a tipping point is the Greenland-ice sheet. The Greenland Ice Sheet (GIS) covers most of Greenland, and reaches a thickness of up to 3500m. The atmospheric temperature decreases with altitude, therefore the temperature at the ice-sheet’s elevated surface is much colder than it would be at sea-level. As the climate warms and the ice starts to melt, the GIS surface elevation will be reduced and its surface temperature will be increased. This feedback loop self-amplifies the melting process, leading to a potentially irreversible melting of the ice-sheet.
Results from CMIP6 show no evidence of climate tipping points being triggered, but the processes leading to these changes can happen on far longer time-scales, as CMIP6 data only goes up to 2100. Future CMIP phases and MIPs can investigate the likelihood of tipping points through new scenarios and longer projection timescales while also using more sophisticated models.
CMIP Panel scientific goals for Future CMIP
Questions from across the CMIP community
What scientific questions do you hope are answered with the help of future CMIP simulations? Let us know by adding your question to the Padlet below. Add your question by clicking the + button in the bottom right-hand corner.
CMIP seminar series
Go to the CMIP Seminar Series webpage →
Recent seminars:
Below is a YouTube playlist of previous seminars. To see other videos in the playlist, click the icon at the top of the video.

Scientific highlights from CMIP
In 2013, WCRP published six scientific Grand Challenges, to emphasise areas of scientific focus for the WCRP over the following decade until 2022. Much of the analysis published using CMIP data in the past decade has aided scientific understanding in these areas.
| WCRP Grand Challenge | Key scientific developments made using CMIP data |
|---|---|
| Advancing understanding of the role of clouds in the general atmospheric circulation | Reduced uncertainty in effective radiative forcing (Smith et al., 2020) combined with increased range in ECS (Meehl et al., 2020) pointing to increased structural diversity among models. |
| Assessing the response of the cryosphere to a warming climate and its global consequences | Combining ScenarioMIP, ISMIP and other lines of evidence to convey “deep uncertainty” in sea level rise above 3C warming in AR6 (Fox-Kemper et al., 2021) |
| Understanding the factors that control water availability over land | Evapo-transpiration and Monsoon changes much better constrained and attributed (Liu et al., 2021, Jin et al, 2020; Moon and Ha, 2020) |
| Assessing climate extremes, what controls them, how they have changed in the past and how they might change in the future | Representation of tropical cyclones and their future trends (Roberts et al., 2020a; 2020b) |
| Understanding and predicting regional sea level change and coastal impacts | Reduced biases and emergent constraints (Lyu et al., 2020) |
| Improving near-term climate predictions | High confidence that initialised predictions contribute information to near-term climate change over multi-annual to decadal timescales (Befort et al., 2020; 2022) |
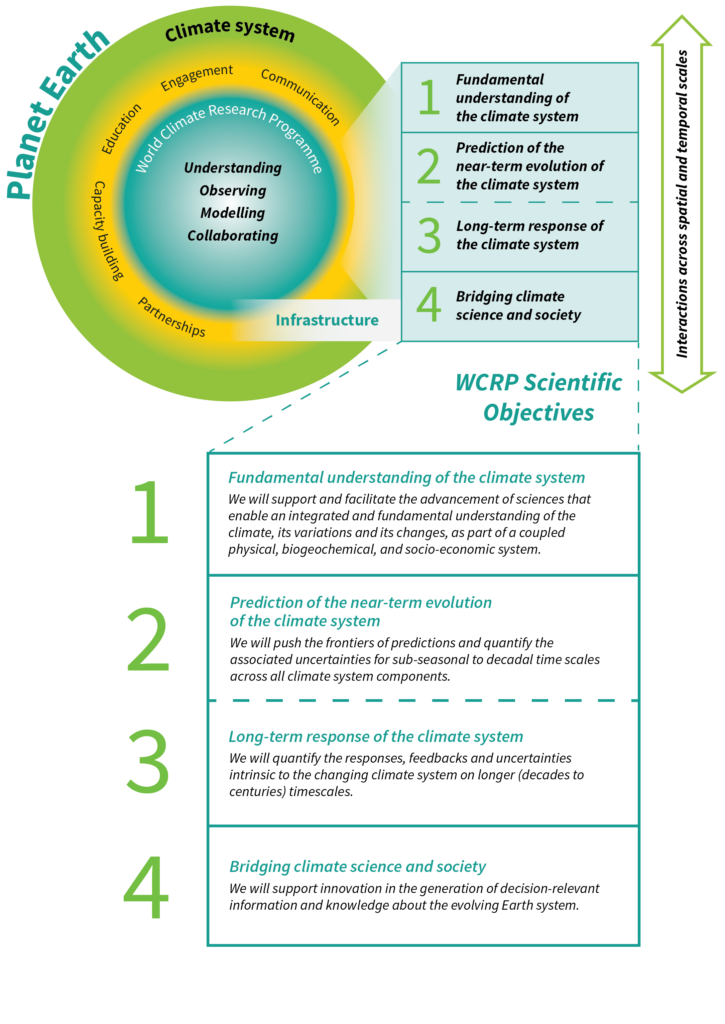
In 2019, WCRP published its new Strategic Plan. This plan is based on four objectives, which will underpin the next decade of climate science. Much of the research utilising CMIP data is actively working towards these four objectives, and these objectives are also at the heart of the CMIP Panel’s plans for Future CMIP phases.
CMIP paper of the week
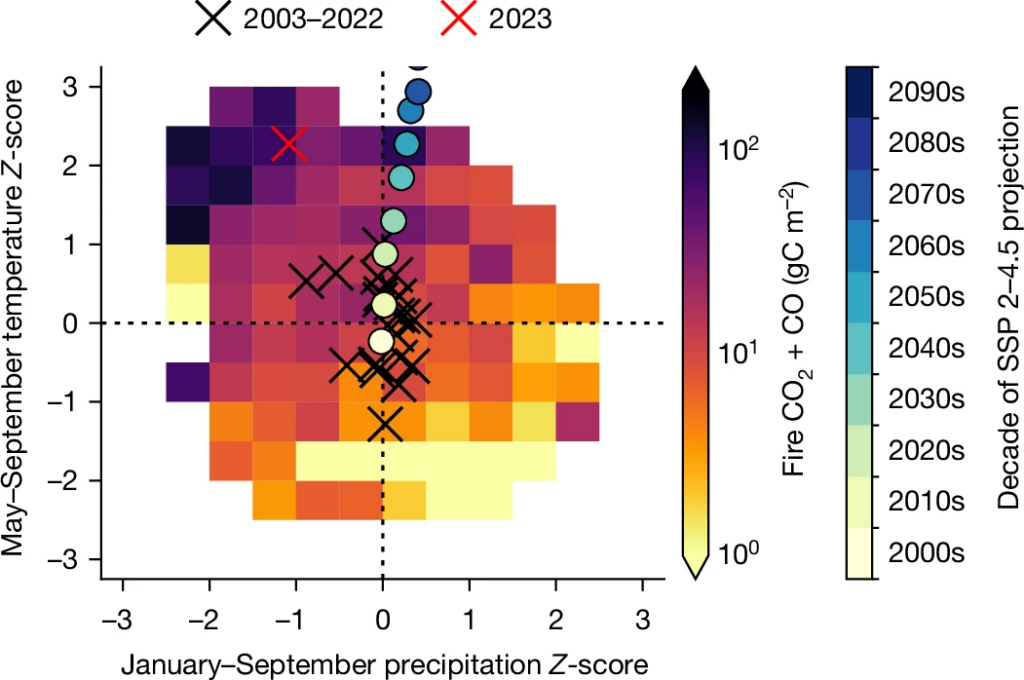
Title: Carbon emissions from the 2023 Canadian wildfires
Authors: Brendan Byrne, Junjie Liu, Kevin W. Bowman, Madeleine Pascolini-Campbell, Abhishek Chatterjee, Sudhanshu Pandey, Kazuyuki Miyazaki, Guido R. van der Werf, Debra Wunch, Paul O. Wennberg, Coleen M. Roehl & Saptarshi Sinha
Abstract: The 2023 Canadian forest fires have been extreme in scale and intensity with more than seven times the average annual area burned compared to the previous four decades. Here, we quantify the carbon emissions from these fires from May to September 2023 on the basis of inverse modelling of satellite carbon monoxide observations. We find that the magnitude of the carbon emissions is 647 TgC (570–727 TgC), comparable to the annual fossil fuel emissions of large nations, with only India, China and the USA releasing more carbon per year. We find that widespread hot–dry weather was a principal driver of fire spread, with 2023 being the warmest and driest year since at least 1980. Although temperatures were extreme relative to the historical record, climate projections indicate that these temperatures are likely to be typical during the 2050s, even under a moderate climate mitigation scenario (shared socioeconomic pathway, SSP 2–4.5). Such conditions are likely to drive increased fire activity and suppress carbon uptake by Canadian forests, adding to concerns about the long-term durability of these forests as a carbon sink.
Link and image source: https://doi.org/10.1038/s41586-024-07878-z
Want us to highlight your paper? ↓
Recent paper highlights
Having trouble viewing the paper gallery? Click here to open in a new tab.